

What is the BankManager learning game?
BankManager is a financial simulation where you, as a participant, are a member of the ‘managing board’ of a publicly listed bank. This bank is active in
retail banking
corporate banking
asset management
Together with your fellow ‘board members’, you are responsible for managing all relevant aspects of the bank. You decide the bank’s strategy. It is your task to fund the balance sheet of the bank. You also decide on what the loan and investment book of the bank should look like. Obviously, you are also responsible for complying with regulatory requirements.
The objective of the BankManager is to give you, and other participants, a good understanding of what banking is all about by actually ‘managing’ a (fictive) bank yourselves. You are evaluated on a wide range of indicators taking all the bank’s stakeholders into account.
What will you learn?
By participating in the BankManager simulation, you will learn, in practice, what the main success drivers are for a bank and what challenges a bank faces. Credit, market, liquidity and operational risks will all be experienced extensively throughout the simulation. You will also learn how to react to competitive forces, e.g. you need to balance risk and return issues, and think about the short- versus long-term strategy of your bank.
How does BankManager practically work?
Introduction
BankManager is usually played in groups of two to five people, who together are responsible for managing their bank. Depending on the length of the session, you will have to manage your bank through an economic cycle of about five to ten years. Every single round in the simulation covers a period of six months.
At the start of the session, a facilitator will make an introduction to the simulation and explain the different screens, and what information you can use. Most of that information is also presented in this document.
After you, and your fellow ‘board members’ have defined a strategy for your bank, analysed your bank’s financials and the external environment, you will have to start making decisions. When all groups have made their decisions, the facilitator will update the session and move the scenario to the next round (a six months move in time). All groups are then provided with updated information about their bank, and the economic environment, on which they can base their decisions for the coming round(s). The simulation is run in a fully online environment.
All amounts are in the same currency, so you do not need to take (foreign) exchange rates into consideration.
How do we define a strategy?
At the start of the simulation, it is important that you and your fellow ‘board members’ think about and discuss what sort of bank you want to be managing. Questions to answer may be:
Do you want to run a conservative bank with large capital buffers and plenty of liquidity? or
Do you want to take on a more aggressive approach by providing loans to ‘riskier, but better yielding’
clients?
Do you actively want to manage an Investment Book for a (hopefully) high return?
Is your strategy about maximising shareholder value, or is client satisfaction more important?
How do you take the interests of other stakeholders, e.g. employees, into account?
Before you define your strategy, you obviously need to analyse the economic environment in which your bank is operating.
On what information do you base your decisions?
To be able to manage your bank, there are a number of screens available in BankManager which contain information (for the current and previous rounds) about your bank and the external environment in which your bank is operating. The different screens you can use are summarised below:
Information about your bank
Overview – graphical overview of your bank’s most important performance indicators and ratios
Financials
Balance Sheet – your bank’s Balance Sheet
Performance – Income and Cash Flow Statements, and details about the Operational Expenses of
your bank
Ratios – relevant Performance & Structure, Risk & Regulatory, Investor & Depositor and Stakeholder
ratios
Investments – details about the Loan and Investment Books of your bank
Funding – details about the Funding Book of your bank
Decisions – where you fill in your decisions with regard to all relevant aspects of your bank
Information about the external environment
Economy
Macro Economy – nine different macro-economic indicators
Interest Rates – historical charts of interest rates of different maturities and the yield curve
Financial Markets – historical charts of different equity, bonds and commodities ‘indices’ plus a
newswire
NPL Stats – development of Non-Performing Loans in various sectors
In the following parts of this manual, you can find more detailed information about the different screens, how to interpret the information and other important things to keep in mind for managing your bank successfully in this simulation.
What impact do your decisions have?
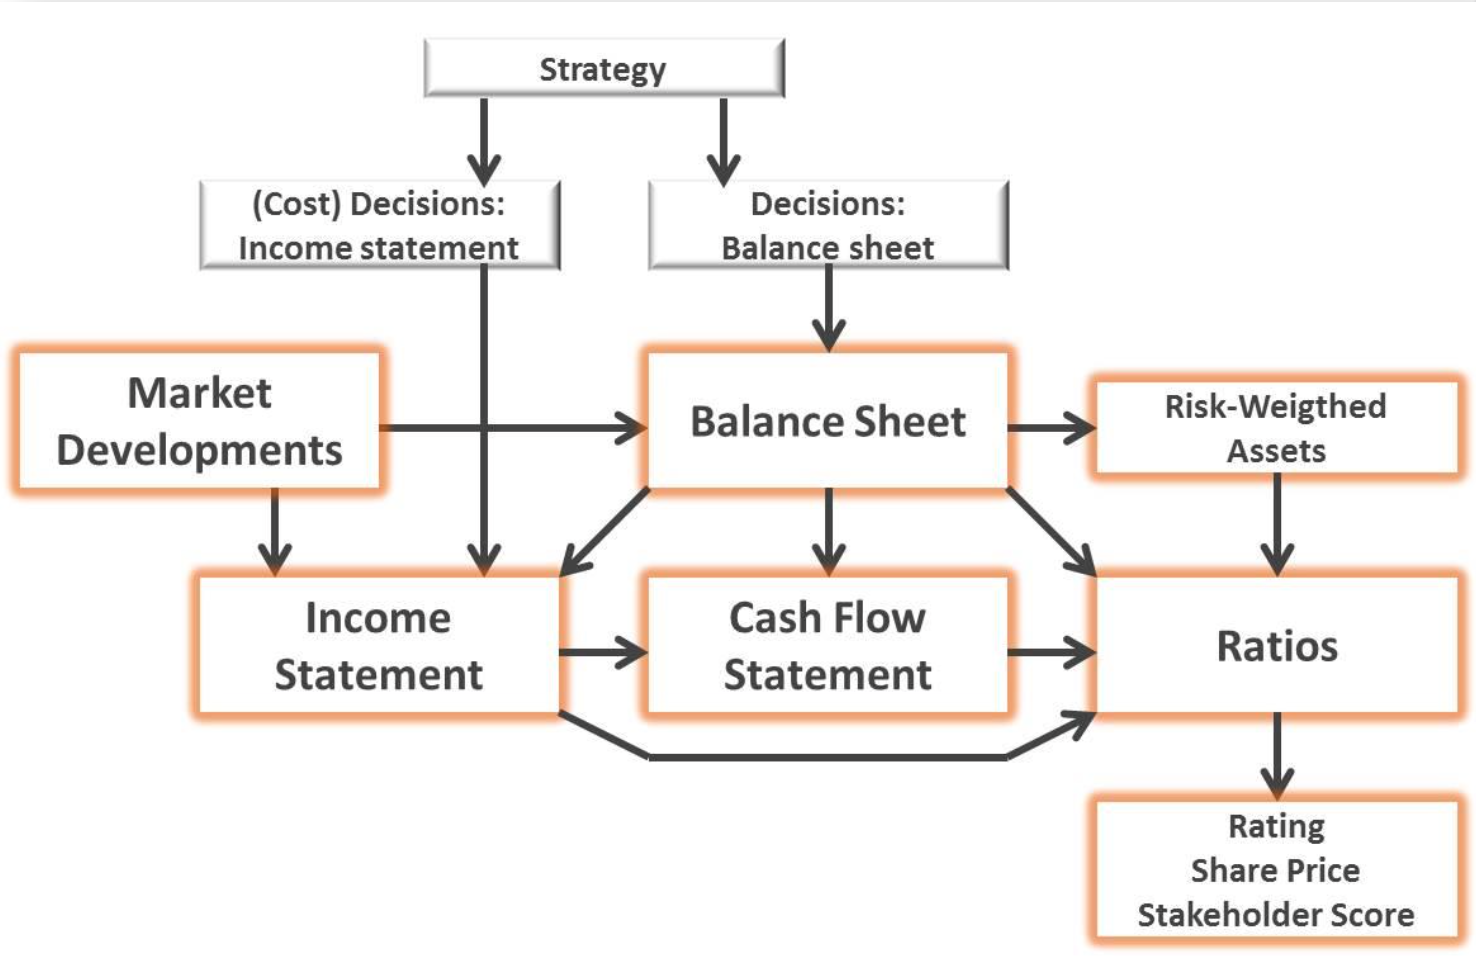
You do not need to be an expert in accounting to understand that your decisions, together with the changing economic environment, will have impact on both the Balance Sheet and the Performance of your bank.
The flow chart (left) explains how all the various ‘pieces’ fit together and what impact your decisions have.
Overview
What can I see on my Overview screen?
Your screen provides you with a graphical overview of your bank’s most important performance indicators and key ratios.
This is a good starting point when analysing the performance of your bank. You can easily spot the desired and undesired trends in the important performance indicators and act on these when needed.
More details on most of the indicators shown on this screen can be found in the other screens of the simulation.
[screenshots including explanation]
Financials
What information can I get from the Financials screen?
The Financials screen is divided into three screens which you can see by pulling the left menu:
Balance Sheet
Performance
Ratios
What can I see on the Balance Sheet screen?
The Balance Sheet screen provides you with a snapshot of the financial situation your bank is in. You can see the amount of each asset and liability item for the every/latest two (?) rounds.
At the start of the simulation all banks will start with the same balance sheet. From the very first round it is up to the different ‘managing boards’ to decide what strategy their bank will pursue, and how they will manage their bank.
Below is an example of what a balance sheet may look like. Each round, all balance sheet items will be updated based on the decisions the various banks have taken and the changes in the external environment.

What do I need to know about my bank’s assets and liabilities?
On the assets side of the Balance Sheet you will find Fixed Assets, your Loan Book, your Investment Book, Current Assets and Cash (equivalents).
Fixed Assets
You need these assets for your bank to function ‘properly’ and they are depreciated over time. The depreciation can be found as an (negative) item on the Income Statement. It is up to you to decide if, and when, you invest in Fixed Assets. If you do not make sufficient investments to e.g. match the growth of your bank’s other assets, BankManager will automatically rent Fixed Assets at a higher cost than if your bank would have owned the assets. The costs for renting Fixed Assets will show up on the income statement as ‘Rent of Fixed Assets’. The fixed Assets which you own are, in the simulation, depreciated as follows:Property: 25 years
Equipment: 5 years
IT Infrastructure: 5 years
Loan Book
The Loan Book is divided into:Corporate Loans
SME (Small and Medium Enterprises) Loans
Leasing
Personal Loans
Loans to Banks
More detailed information about loans within these categories can be found on the Investments screen.
Investment Book
The Investment Book is divided into:Equity
Fixed Income
Commodities
These items show the mark-to-market value of the investments you have made in your Investment Book. More detailed information about the actual investments can be found on the Investments screen. Price movements of the different instruments are plotted in the Markets screen.
Current Assets
The Current Assets consist of Receivables and Tax Assets. Receivables are shown only when you have positions in the Investment Book as these represent dividend (on equity) and coupons (from fixed income) to be received. The Tax Assets are the amount of tax your bank is due to ‘receive’ from a negative net operating result in the previous round.
Cash Equivalents
Cash Equivalents consists of Central Bank Reserves and Cash. The amount of reserves your bank needs to hold at the Central Bank is in the simulation equal to 5% of the size of the total Loan and Investment Books. If your bank’s cash position becomes negative (i.e. you run out of cash), the Central Bank Reserves can be used to fulfil any short term obligations you may have. If the Central Bank Reserves are not sufficient to fulfil these obligations, the Central Bank will automatically lend your bank the amount needed (at a very high interest rate!), which will show up under Deposits from the Central Bank on the liability side of the Balance Sheet.
On the liability side of the Balance Sheet you will find Equity, your Funding Book and Current Liabilities.
Equity
Equity is divided into:Paid-in Capital, which represents the amount of Paid-in Capital your bank received when it was incorporated. During the simulation, your bank has the opportunity to issue additional shares to raise more (Paid-in) Capital. If new shares are issued, the newly raised (Paid-in) Capital will be added to the Paid-in Capital which was already there at the start of the simulation.
Retained Earnings, which represent the cumulative Retained Earnings (or losses) since your bank was incorporated. If additional shares are issued, the retained earnings would have to be split between more shareholders, hence issuing additional shares when the bank has positive Retained Earnings will lead to a dilution of the Share Price.
Treasury Stock, which represents the value of redeemed shares (i.e. you buy back shares which have previously been issued). The value of Treasury Stock on the Balance Sheet shows the total number of shares that have been bought back multiplied by the nominal value per share.
Funding Book
The overall funding book of your bank is divided into:Subordinated Debt
Debt Securities in Issue
Customer Deposits
Deposits from Banks
Deposits from the Central Bank
More details on the actual composition of the Funding Book can be found on the Funding screen. In case your bank runs out of cash to fulfil your short term obligations, the Central Bank will automatically place an emergency deposit with your bank to cover the deficit. This deposit will be shown under Deposits from the Central Bank (and is granted at a very high interest rate!).
Current liabilities
The Current Liabilities consist of Payables and Tax Liabilities. Payables are shown only when you have positions in the Investment Book as these represent brokerage fees to be paid. The Tax Liabilities are the amount of tax your bank is due to pay on a positive net operating result in the previous round.
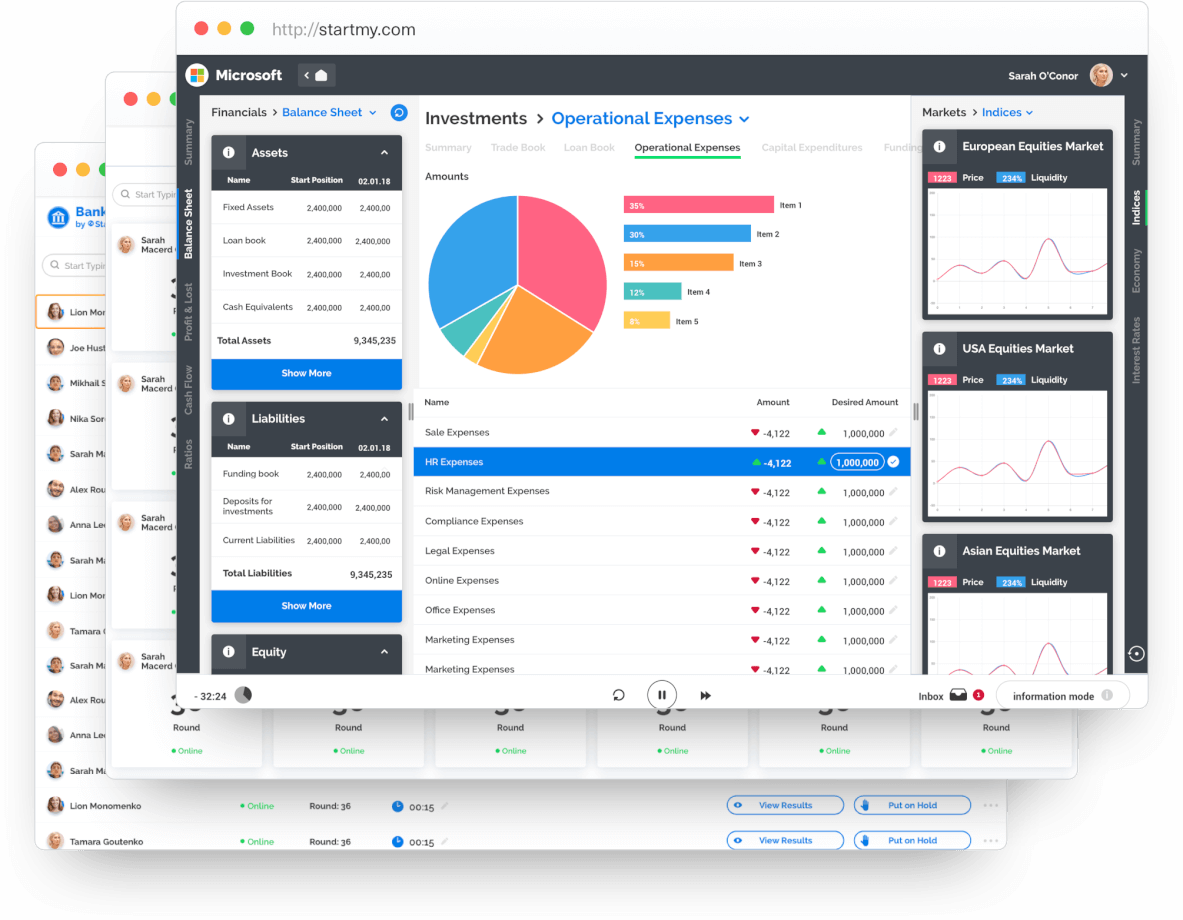
What can I see on the Performance screen?
The Performance screen shows your bank’s Income Statement, Cash Flow Statement and a breakdown of the Operational Expenses.
[screenshot]
Income Statement
The Income Statement provides details on the composition of your bank’s profits or losses. It is important to realise that a couple of items in the Income Statement are linked to how much you invest in Fixed Assets and spend on Operational Expenses (see below).Cash Flow Statement
The Cash Flow Statement shows a breakdown of the cash movement in for each round. It is important to have an insight into what the different causes are for these cash movements. More detailed information about the changes in the Loan Book and Investment Book can be found on the Investments screen. Details about the changes in the Funding Book can be found on the Funding screen.Operational Expenses
The table with Operational Expenses provides a breakdown of how you divide your expenses. If you grow your balance sheet, you should also grow your operational expenses more or less at a similar pace. If you for example ‘under-invest’ in risk management and IT infrastructure it will have a negative effect on the amount of your actual Credit Losses. It is important to keep an eye on the amounts which you spend on each item as it has effects on the various stakeholder scores.
What can I see on the Ratios screen?
When you manage your bank, it is crucial that you have good management information, and can interpret it, to make your decisions. Ratios are useful management information. On the Ratios screen you will find four tables with the following ratio groups:
Performance & Structure ratios
Risk & Regulatory ratios
Investor & Depositor ratios
Stakeholder Scores
[screenshot]
What do the Performance & Structure ratios mean?
Net Interest Margin = Net Interest Income / Interest Income (as shown on the Income Statement)
Net Interest Income Growth = % change in Net Interest income compared to the previous round
Net Operating Income Growth = % change in Net Operating Income before Taxation compared to the
previous round
Cost / Income Ratio = (Staff Expenses + Other Operating Expenses + Depreciation + Rent of Fixed Assets)
/ Net Operating Income
Deposits / Total Loans = Total Deposits / Total Loans outstanding
Duration Assets = weighted average maturity of total Loan Book, expressed in years
Duration Liabilities = weighted average maturity of total Funding Book, expressed in years
InterestRateGap= FixedRateLiabilities-FixedRateAssets
Total Debt / Total Equity = (Total Liabilities – Payables – Tax Liabilities) / Total Equity
What do the Risk & Regulatory ratios mean?
Risk Weighted Assets (‘RWA’) = (Real Estate, Pharma & Biotech, ICT & Media, SME, Loans to Banks) * 100% + (Student Loans, Car Loans, Credit Cards) * 75% + (Food & Agri, Consumer Goods, Automotive, Leasing) * 50% + Mortgages * 35% + Investment Book * 125%
Tier 1 Capital = Total Equity
Tier 1 Capital / RWA (a.k.a. Solvency) = Total Equity / RWA
Total Capital / RWA = (Total Equity + Subordinated Debt) / RWA
Leverage = Total Equity / Total Assets
Cash Equivalents / Total Assets = (Central Bank Reserves + Cash) / Total Assets
Liquidity Coverage Ratio (LCR) = (Cash Equivalents + Investments in Bonds + Loans to Banks) /
(Customer Deposits + Deposits from Banks)
Net Stable Funding Ratio (NSFR) = (Subordinated Debt + Debt Securities in Issue + Customer Deposits +
Equity) / (Corporate Loans + SME loans + Mortgages + Student Loans + Car Loans)
NPL / Total Loans = absolute amount of Non-Performing Loans / Total Loans outstanding
Credit Losses / Total Loans = Actual Credit Losses (as shown on P&L) / Total Loans outstanding
What do the Investor & Depositor ratios mean?
Share Price = (Total Equity / Number of Shares Issued) * Market Factor
Number of Shares Outstanding = total Number of Shares Issued – number of Shares Bought Back
Market Capitalisation = Share Price * Number of Shares outstanding
Return on Equity (RoE) = Net Profit after Dividend / Total Equity
Return on RWA = Net Profit after Dividend / RWA
Dividend Yield = Dividends / Market Capitalisation
Pay-out Ratio = Dividends / Net Profit after Dividend
Price to Earnings = Net Profit after Dividend / Market Capitalisation
Return on Investment Book = Profit or Loss on Investment Book / Total Position Investment Book
Credit Rating = input variables to determine the credit rating are:
Tier 1 Capital / RWA (a.k.a. Solvency)
Leverage
Liquidity Coverage Ratio (LCR)
Net Stable Funding Ratio (NSFR)
Return on Equity (RoE)
Cost / Income ratio
Net interest margin
On what are the Stakeholder Scores based?
Regulator: Tier 1 Capital / RWA, Liquidity Coverage Ratio and NPL / Total Loans
Staff: Staff Expenses, Catering & Cleaning Expenses and Net Profit
Equity Investors: Share Price, RoE and Pay-out ratio
Debt Investors: Credit Rating, Total Debt / Equity and Liquidity Coverage Ratio
Depositors: Marketing Expenses and Competitiveness of Deposit rates
Borrowers: Credit Rating, Marketing Expenses and Competitiveness of Loan rates,
Public Opinion: Credit Rating, Marketing Expenses and Return on RWA
Overall Score: Weighted average of the individual stakeholder scores
Investments
What can I see on the Investments screen?
On the Investments screen you can find detailed information about your bank’s Loan and Investment Books.
[screenshot]
What do I see in the columns of the Loan Book?
The following information with regard to the various loan types your bank has on its books is shown on this screen:
Current Position = the nominal values of the outstanding loans in the current round
Previous Position = the nominal values of the outstanding loans in the previous round (6 months ago)
NPL (abs/round) = the nominal amount of non-performing loans in the current round
NPL (% p/a) = the annualised percentage of non-performing loans
Rate New Loans = the rate at which your bank issues new loans in each category
Avg Portf. Rate = the average lending rate per category which you are receiving, including legacy
positions
Avg Mkt Rate = the average rate at which the market players are granting loans per category
Recovery Rate = how much of a defaulted loan you can a recover by selling assets you hold as collateral
for the loan
Avg Duration = the average maturity of the Loan Book items, expressed in years
What do I see in the columns of the Investment Book?
The following information with regard to the various investment types your bank has on its books is shown on this screen:
# Units = the number of Units (volume) your bank has on its book
Current Price = the price of the specific instrument in the current round
Previous Price = the price of the specific instrument in the previous round (6 months ago)
Value = the number of Units (volume) * Current Price
Profit and Loss = the number of Units (volume) * (Current Price – Previous Price)
Funding
What can I see on the Funding screen?
The Funding screen shows details on how your bank is funded, including any possible Central Bank loans.
[screenshot]
What do I see in the columns of the Funding Book?
The following information with regard to the various funding sources of your bank is shown on this screen:
Current position = the nominal values of funding per category in the current round
Previous position = the nominal values of funding per category in the previous round (6 months ago)
Avg Portfolio Rate = the average funding rate per category which you are paying. If no new debt is
issued in a certain category, this rate will not change
Rate New Debt Issuance = the rate at which new funding can be raised in the market. This is rate is the
current interbank interest rate for the relevant tenor plus a margin which is dependent on the credit rating of your bank. The lower the credit rating, the higher the margin. The margin increases on an exponential scale as your rating deteriorates.
Market Rate = the current interbank interest rate for the relevant tenor
Avg Duration = the average maturity of the Funding Book items, expressed in years
On the right-hand side of the screen you will find a table that contains an overview of the upcoming debt maturities per round. In the picture above you can for example see that there is an amount of 1,000 due at the end of round 2 when the current 1 year bond is maturing and another 1,000 is due at the end of round 6 when the first 3 year bond is maturing. Maturing bonds will have to be repaid so take this into consideration when determining the total amount of funding needed for future rounds.
Economy
What information can I get from the Economy menu?
The Economy tab is divided into three screens which you can see by pulling the menu:
Macro Economy
Interest Rates
Financial Markets
What can I see on the Macro Economy screen?
On the Macro Economy screen you will see nine macroeconomic indicators. By analysing these indicators you can form an opinion about the state of the economy. Using these indicators in combination with the information that can be found in Rates, Markets and NPL Stats screens, you should be able to anticipate the potential future economic developments which will have an impact on your bank in a variety of ways. It is important to continuously ask yourself questions such as Do we have the right product mix for the current market? or How will customer demand change given the state of the economy?
One indicator shown on the Economy screen, the Cyclicality Index, is not a regular macroeconomic indicator. It is an indicator which has been constructed by the makers of BankManager to provide an overall picture of the economy cycle, and to help you in ‘getting a grip’ of the state of the economy. This index combines a variety a macroeconomic indicators.
[screenshot]
What can I see on the Interest Rates screen?
On the Interest Rates screen, the official Central Bank rate and the interbank interest rates for different maturities are shown. Additionally, a yield curve is plotted. Changes in the yield curve (flattening or steepening) can have significant consequences for your bank and should steer your decisions.
Information about various interest rate levels is obviously crucial when managing a bank. It is the starting point for both the price setting of the loans in the Loan Book (interest income) and the price setting of deposits in the Funding Book (interest expense).
Your bank’s profitability largely depends on your ability to manage your interest rate margin, i.e. the interest clients pay on their loans minus the interest you pay for your funding.
[screenshot]
What can I see on the Financial Markets screen?
The Financial Markets screen contains the charts of three equity indices, three bonds ‘indices’ and the ‘indices’ of three commodity baskets. A news wire can also be found on the Markets screen. Each round news items are posted describing what is happening in the global economy.
No matter what sort of bank you are managing, it is imperative to know what is happening in the financial markets as this will, more of less directly, have an impact on your bank.
[screenshot]
NPL Stats
What can I see on the NPL Stats screen?
The NPL Stats screen contains chart information about Non-Performing Loans and Actual Credit Losses for all the various loan categories (industries) which you can grant loans to. The orange line (NPL) on each chart shows the annualised % of loans that are non-performing in a certain sector. The green line on each chart shows the annualised % of Actual Loan Losses, i.e. NPL * (100% – Recovery Rate). This basically tells you how much the actual credit loss will be for the bank, in case of a default on the loan.
When determining the price you want to charge for new loans, the interbank rates are obviously important, but it is also crucial to take the credit risk per industry sector into account, i.e. how large parts of the loans given are possibly not being repaid (NPL).
If a loan is non-performing, it does not always mean that the bank will lose all the money it has lent to the borrower. Often, the bank has recourse to certain assets as collateral in case of a default. The availability and quality of these assets determines the recovery rate for each loan. The higher the recovery rate, the lower the actual realised loss will be.
[Screenshot]
Decisions
What can I do on the Decisions screen?
On the Decision screen, under the various tabs, you can make decisions to try to steer your bank in the direction of your strategy. All your decisions need to be entered on the Decisions screen. This screen contains five different tabs for the various categories of decisions.
It might be that some tabs are disabled at times, especially in the beginning of a session, to have you concentrate on some specific aspects of the simulation. It is up to the facilitator to decide which decisions are enabled or not.
[Screenshot]
The tabs you can see on the Decisions screen are:
Fixed Assets and P&L Items
On the Fixed Assets and P&L Items tab you can enter how much (in absolute terms) you want to invest in Fixed Assets (left-hand side of the screen) and how much (also in absolute terms) to spend on different departments within your bank (right-hand side of the screen).
It is important to have an ‘appropriate’ level of Fixed Assets in your bank, as these assets are deprecated over time. It is also vital to spend ‘sufficiently’ on the different departments to match the growth of your bank (If you want to grow, you also need to invest in staff...). Higher operational expenses do of course lead to higher expenses in the Income Statement. ‘Underspending’ can cause operational risks and unhappy stakeholders, which in turn can have negative consequences for your bank.
Loan Book
In the Loan Book tab you can enter decisions regarding the lending activities of your bank. In the table on the left-hand side of the screen, you can enter your desired amount of total lending per category.
Entering a certain amount of desired lending does not mean you will automatically grant that amount to borrowers. The actual amount of lending you are able to grant depends on how competitive your demanded interest rates are, and the overall conditions in the lending market.
Please keep in mind that every round, some of your existing loans will be repaid: The longer the maturity of the loans, the slower they will be repaid. This means that when no changes are made to the amount of loans, the size of the Loan Book will decrease in every round.
In the table on the right-hand side of the screen, you can set the interest rate your bank is demanding to grant new loans.
Investment Book
In the Investment Book tab you can enter decisions regarding the (possible) investment activities of your bank. In the table you can enter your desired number of units you want to buy or sell of the ‘indices’ which are available in the Investment Book.If you, for example want to invest a nominal value of 10,000 in an index, and the current price of that index is 200, the number of units to enter into the decision screen is 50.
If you want to increase your holding of an index, you increase the number of units in the decision screen.
If you want to decrease your holding of an index, you lower the number of units in the decision screen (to a minimum of zero, as short selling is not allowed in this BankManager).
Please be aware that your possible investment activities should be a reflection of your strategy. If your strategy is to be a retail bank, or if you want to manage your bank with as little risk as possible, you should be very careful of being involved in investments.
The size of your Investment Book in relation to the size of your total Balance Sheet has an impact on some of the (risk) score: The larger % of Investment Book / Balance Sheet, the more risk.
Equity
In the Equity tab, you can raise additional equity (which will be added to Paid-in Capital in the Balance Sheet) or buy back shares which have already been issued (which will be showing as a negative amount under Treasury Stock on the Balance Sheet) by filling in the number of shares to either issue or buy back.The Dividends you pay your shareholders can also be changed in this tab. The amount of dividends that will be paid is the percentage you enter multiplied by the total amount of Equity (Paid-in Capital + Retained Earnings – Treasury Stock) on the Balance Sheet.
Funding Book
In the Funding Book tab you can enter decisions regarding how you want to fund your assets. In the table on the left-hand side of the screen, you can enter your desired amount of total funding per category.Entering a certain amount of desired funding does not mean you will automatically raise that amount from the market. The actual amount of funding you are able to raise depends on how competitive the interest rates you offer are (deposits), and the overall conditions in the funding market.
Please keep in mind that every round, some of your existing funding needs to be repaid: The shorter the maturity of the funding, the quicker you need to repay. This means that when no changes are made to the amount of funding, the size of the Funding Book will decrease in every round.
In the table on the right-hand side of the screen, you can set the interest rate your bank is willing to pay for new deposits. The interest rate you enter for Time Deposits is the rate you are willing to pay for new time deposits acquired in the next round. The interest rate you enter for Demand Deposits is the rate you are willing to pay for all demand deposits in the next round. You cannot set the rate of funding sources other than customer deposits. The rates you need to pay on subordinated loans and bonds is determined by the current interbank interest rate for the relevant tenor plus a margin which is dependent on the credit rating of your bank – the lower the credit rating, the higher the margin. The margin increases on an exponential scale as your rating deteriorates.